Monday, September 26, 2011

September 26: First Day of Fall Brings Soaking Rainfall East of Blue Ridge


Professor Storm's Note:  This blog was written by Alexandra St. Pe, who recently received her meteorology degree and has joined Professor Halverson's research group, where she is studying hurricanes and severe storms. 

After a wet and overcast week, the first day of fall (Friday, September 23, 2011) did not bring comfortable fall-like conditions, but rather heavy afternoon rainfall that initiated Flash Flood watches and warnings across the Mid-Atlantic. Interestingly enough these conditions are not caused by a powerful cyclone sweeping through the region, but rather a sluggish frontal boundary stalling just east of the Blue Ridge Mountains. In fact, the main weather system, an upper-level low, remains stalled over the Great Lakes.  The vortex is keeping the Baltimore-Washington corridor under overcast conditions yet again. Below I will break down the factors that precluded Friday’s rain event, discuss the numerical weather model output for the event, then follow up with rainfall accumulations and climatological plots for Baltimore.

Synoptic Set-up:

Beginning overnight Thursday, a deep southerly wind flow ushered in a tropical plume type air mass.  This flow strengthened as the pressure gradient tightened between the deepening upper-level low over the Great Lakes and a building ridge of high pressure over the West Atlantic.

This upper-level feature was coupled within a jet streak (a pocket of localized fast wind embedded within the jet stream), which produced widespread rising air, setting us up for a widespread rain event.

The jet streak is shown by the light blue and turquoise colors in the upper-level analysis below.   This pocket of fast winds was moving around the eastern side of the stationary upper-level vortex parked over the Great Lakes.
 
The Friday early morning analysis (8 EDT) shows a surface trough (dashed yellow line), ahead of a stationary front to the west, stretching from the southern Appalachians northeastward as far north as Massachusetts. With strong southwesterly flow (blue wind barbs) and a moist atmosphere on hand, the frontal boundary enhanced the uplift of air in a north-south ribbon oriented over the Mid Atlantic. The area of precipitation filled in along this boundary throughout the morning as it lifted northward. 
 
Friday morning  (8am EDT) atmospheric weather balloon data indicated that the atmosphere was primed for a heavy downpour as the air remained saturated (indicated by red temperature line and green dew point line overlapping within the lowest 2 km of the atmosphere).
  Another good indicator for heavy rain was the Precipitable Water (PW) value (a measure of the total amount of moisture in the troposphere), which was approaching 2 inches across the region.   Note the tongue of high PW values (dark green shades) extending over the Mid Atlantic, rooted in the tropics, and streaming along the stationary front just to our west.
 
Weather Model Forecasts:

Although the general model consensus was for the axis of most intense rain to align near the I-95 corridor, there was variability in the W-E orientation. Unfortunately numerical weather predication models struggle with precipitation amounts due to resolution constraints. However, the Rapid Update Cycle, which is the most frequently updating and operational weather prediction model, did place a precipitation maximum ending by 2100 UTC (5 pm EDT) of  more than 3 inches across southeast Pennsylvania and across central/western Maryland and Virginia.
 
The NWS was aware that Friday would be an extremely wet day, and issued numerous Flash Flood watches and warnings across the region to prevent hazardous impacts. These watches were necessitated by the recent heavy rains from tropical storms Irene and Lee, which deposited one to two feet of rain across our region.  However, due to limintations in the weather prediction models, NWS graphical forecasts were still a few inches shy of total rainfall accumulation by 8pm EDT.
 
The NWS in Sterling, VA has now released preliminary rainfall accumulations from this event which suggested nearly 4.5 inches around portions of northeast Baltimore County, and barely one inch for most locations in Howard county.

Rainfall Accumulations:

The combination of a strengthening southerly jet, formation of a surface boundary east of the Blue Ridge, and jet streak over the Great Lakes all served to enhance lift and sustain drenching rainfall across the Baltimore – Washington corridor. Below is the total rainfall distribution courtesy of NOAA’s Advanced Hydrologic Prediction Service. It is a 7-Day analysis, but since most of the rainfall over the past 7 days fell on Friday, September 23rd, the most intense rain axis of 2 - 5 inches occurred during Friday’s event. From this analysis, and from the previous discussion, is the distribution of heaviest rainfall a surprise?

As presented in previous blog posts, the question remains: Is there a ‘preferred mode’ that commonly sets up a north-south rain axis of high intensity across the Mid-Atlantic? 
Climate Plots:

Finally, climatology model data suggests that a daily precipitation record was tied at the BWI airport and that this heavy rainfall event, although much shorter in duration, registered single day rainfall totals similar in magnitude to the remnants of Tropical Storm Lee. And as displayed in the final climate plot, both of September’s heavy rainfall events have contributed immensely to the region’s “above normal” climatological precipitation pattern.


Thursday, September 15, 2011

September 15: Region's Heavy Tropical Rains in Early September Extremely Rare

The NWS released a public information statement.  They are in the process of compiling and analyzing rain gauge reports in the Washington-Baltimore region from Hurricane Irene and Ex-Tropical Storm Lee.  There are a few stations (including Largo, MD and Forestville, MD) that recorded a total of ***24 INCHES*** of rainfall from these two storms.   To put this in perspective, our region averages about 35"-40" of rain in any given year.  Imagine receiving 2/3 of this in the space of a single week!

Additionally, stations in Northern Virginia accumulated rainfall at such an extreme rate that these locations have effectively just experienced a 500- to 1000- year storm event.

The hydrologic (land surface) response to these events was quite varied across the Mid Atlantic.  These aspects are being studied by Professor Andrew Miller and colleagues in UMBC's Geography Department.

September 15: Tornado Just Off Ocean City

The photo below shows a tornado in the vicinity of Ocean City, MD taken this afternoon.   The tornado was produced by a thunderstorm cell that formed in unstable air, ahead of a strong cold front pushing across Maryland.    The large, funnel-shaped appearance of the tornado cloud and broad spray ring suggests that this developed as a tornado over land and subsequently moved offshore, as opposed to a waterspout that initiated over the ocean - but the NWS is trying to substantiate this.  Tornadoes - even those that move over water - tend to contain higher wind speeds than waterspouts.  Tornadoes and waterspouts also form by different mechanisms.
My own examination of the radar imagery this afternoon (shown below) identifies the cluster of thunderstorm cells that I believe may have generated the tornado (located inside the thick red circle).  The cold front advancing across Maryland (thick, solid blue line) is also shown.

Friday, September 9, 2011

September 9, 2011: Tropical Rain Catastrophes In The Washington-Baltimore Corridor: A Repeating Pattern?

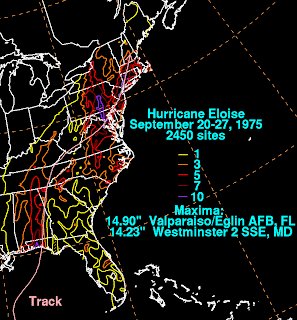
I've gone into the meteorological archives and extracted the truly catastrophic tropical rain events in the last 50 years over the Washington-Baltimore region.   There are four significant storms, each producing 10"-15" across our greater urban area during a multi-day period.  They are:

1.  Hurricane Agnes, June 1972 (max 19", Schuylkill County, Central PA)
2.  Hurricane Eloise, September 1975 (max 14", Westminster, Central MD)
3.  Unnamed Tropical Plume, June 2006 (max 17", Tamaqua, Central PA)
4.  Tropical Storm Lee, September, 2011 (preliminary max 15"+, NOVA)

The rain accumulation maps for these four events are posted below.  Note that the first three are based on Dave Roth's (NOAA) analysis of thousands of rain gauges.  It will take some time for his group to do a similar, definitive analysis for Tropical Storm Lee;  for now, we are using radar estimates, which can be off by a factor of two compared to gauges (click on these to enlarge):


There are four major tropical rain storms in 50 years, each producing different degrees and types of hydrological response, but there are remarkable similarities in the heavy rain distribution.  Considering just the Mid Atlantic, all four events feature a narrow swath of 10"-15" oriented north-south and extending from north-central VA through central MD then into central PA...and including the major cities of Washington and Baltimore.  This heavy rain swath seems to set up regardless of the track of the tropical cyclone (if there was one), or its intensity at landfall.   The big question:  Is all of this just coincidence, or do these analyses suggest that there is a recurring, perhaps predictable set of processes - a "preferred mode" - that defines rain axis intensity, orientation and persistence in our part of the world?

Clearly, there is some work that needs to be done here, to better understand the dynamics and physiographic interactions.   What I can say, after a preliminary look at all the meteorological charts, is this:

1.  Each case featured a deep plume of tropical moisture circulating into the core remnants of the storm, or just a narrow tropical plume.  The plume contains southerly winds that import high humidity air over the region;
2.  Each case featured a north-south oriented stationary front draped through the region...along which the tropical moisture spread northward.   When moist, southerly airflow was constrained to flow along this front, a pattern of repeat echo training was established;
3.  North of the Mason-Dixon line, the corridor of tropical airflow impinged upon the Appalachians, which are oriented west-east across South-Central PA.  This helped propagate heavy rain cells in a narrow corridor northward through PA.

There are many other aspects that come into play...including the overall progression (speed) of the parent tropical circulation, its intensity as it moved inland, its interaction with dynamical processes in the upper troposphere such as jet stream troughs and jet streaks, etc.   But perhaps there is a core set of processes and configurations common to all of these high impact events...making this densely populated region particularly vulnerable to repeated, catastrophic rain events of a tropical nature.

In terms of the large-scale ingredients that lead to the Lee rainfall disaster, the following diagram attempts to portray some of them.  Lee's large circulation moved very slowly up the spine of the Appalachians.  A persistent conduit of tropical moisture was pulled northward over the Mid Atlantic on Lee's east side.  A stationary front (which at times became incorporated into Lee's remnant circulation as a warm front during the system's extratropical transition) remained over Washington-Baltimore for several days.  The front, oriented parallel to and embedded within the moisture plume, served as a persistent focus for heavy rain by lifting moist, tropical air.   Finally, note that Lee's circulation did something quite rare - it headed westward on Sept 8-9.  Such motion is termed retrograde movement.

Wednesday, September 7, 2011

September 7, 2011: Serious Hydrological Event Underway

The remnants of ex-Lee continue to impact the Baltimore region.  The large-scale storm circulation has become nearly stationary, and is located over the Great Smoky Mountains...where it was yesterday.   On its eastern side, a warm front remains draped across the Washington-Baltimore region.  A tropical plume of high humidity is being lifted along this front.
Surface map, 8 AM, showing ex-Lee's circulation situated over Appalachia.  A warm front extends northward across Washington-Baltimore.
Plume of high tropical moisture streaming from south to north over the Washington-Baltimore region.
The movie below shows a phenomenon called echo training...whereby storm cells form within the tropical moisture plume, and move repeatedly over the same locations.   The cells are developing south of Baltimore, and moving northward across the city, one after another.  Each cell dumps a load of rain.  Then the next one arrives.  The "train" sets up whenever the winds aloft blow parallel to a stalled front.  In this case, very humid flow from the south is running parallel to the warm front, which is also oriented south to north.   The result is a very wet conveyor belt:
Shown below are the flash flood warnings that have been posted for our region...note how they all run along the axis of the echo train:

Tuesday, September 6, 2011

September 6, 2011: Lee's Tropical Plume Soaks The Mid Atlantic

On Sunday, September 4, the broad circulation of Tropical Storm Lee came onshore along Louisiana.   The wind field around the storm's core rapidly weakened, but heavy rain has become problematic across the entire U.S. east of the Mississippi.  Ex-Lee's post-tropical circulation continues to import vast amounts of moisture northward out of the Gulf of Mexico.  This plume of tropical air, called an "atmospheric river", shows up in the satellite water vapor imagery, and is analyzed in terms of "precipitable water" (shown below).   Precipitable water is a simple measure of the total water vapor content of the air.   Professor Ray Hoff in Physics pointed out an atmospheric river impacting the West Coast, but we get them here in the East as well:
Deep, continuous river of tropical moisture extending from the Gulf of Mexico over the Mid Atlantic.
This plume of tropical moisture (dark green shades, up to 2.5" precipitable water) has its origins in the western Gulf of Mexico.  The plume is overriding a stationary front anchored along the spine of the Appalachians, stretching from Florida to Maine.  Lee's remnant circulation has become embedded in this front, and is moving slowly toward the northeast along the frontal boundary.   The sequence of two figures below shows how Lee interacted with this front (the first weather map shows conditions at 8 AM Monday, the second shows 8 AM today).   When a post-tropical weather system combines with a front in this manner, and a wave-type frontal cyclone structure develops, the evolutionary process is called extratropical transition (ET).  As ET unfolds, all types of severe and hazardous weather can ensue...sometimes hundreds of miles inland from the coastline. 
Surface weather map, 8 AM Monday, showing Tropical Storm Lee making landfall.  Note the extensive slow-moving cold front along the Appalchians.
Surface weather map, 8 AM Tuesday.  Lee's circulation is now embedded within the cold front, and is evolving into a classic mid-latitude wave cyclone.  The entire system is lifting slowly toward the northeast.
Another facet of inland, post-tropical evolution is tornado formation.  In the 8 AM Tuesday weather map above, note the red tornado watch boxes issued for the Carolinas.  The favored location for tornado formation in decaying tropical remnants is the right front quadrant of the storm.  This is where the low level wind shear, and potential for air to develop rotation, is greatest.

Here is a more detailed, regional (mesoscale) surface analysis of ex-Lee.  Early this afternoon, the storm center was located over the Smoky Mountains.  The pressure gradient is fairly weak, so widespread strong winds are not a concern.  Note several spiral rain bands sweeping over the Carolinas and southeastern Virginia.  Also note how the isobars (solid black lines) dip southward across Virginia.  This pattern is suggestive of Appalachian cold air damming.  In cold air damming, low-level winds get channeled from the northeast, from the cool North Atlantic, down the Virginia Piedmont.   This cool dome of surface air, trapped up against the Appalachians, is one reason why temperatures are struggling to climb out of the mid-60's today.
Detailed analysis of ex-Lee centered over Ashville, N.C.  Note the spiral rain bands on the storm's eastern side, some of which may be producing tornadoes.
In case you are wondering how much rain will fall, and where, the Hydrometeorological Prediction Center (HPC) offers this forecast for 5-day rain accumulation:
HPC prediction of 5-day total rain accumulation.
The heaviest pocket of rain, 10"+, is expected to fall west of the Allegheny Front.   This is significantly west of where Irene produced heavy rain, which amounted to 8"-10" along the coastal plain.   It seems that the combination of orographic rain enhancement (lifting of tropical air along the Appalachians) and the tendency for heavy rains to fall left of track in post-tropical, inland storms...are two explanations in support of HPC's prediction.

Monday, September 5, 2011

September 5, 2011: Katia and Lee

This dramatic image shows Hurricane Katia at Cat 2 intensity in the Atlantic and the post-tropical remnants of (former) Tropical Storm Lee along the Gulf Coast.  This is a false-color infrared satellite image from Sunday, September 4;  red colors highlight the tallest cloud tops.  There is quite a dramatic difference in the structure of these two tropical tempests.  Katia is very compact with an enormous, central cluster of deep thunderstorms - called a convective burst.   Ex-Lee, on the other hand, is much more sprawling and asymmetric.  The center is somewhat open, with dry air off the continent sweeping into the center from the west.  A rain band containing intense thunderstorms lies over the Gulf of Mexico.  Rain bands such as these have been repeatedly moving northward across the coastal states, bringing episode after episode of heavy tropical rains.

As of this morning, Katia is expected to recurve away from the U.S. East Coat and accelerate toward the northeast, later in the week.  The post-tropical remnants of Lee are predicted to move slowly northward along the Eastern Seaboard through the week.   The remnants will approach the Mid Atlantic, advancing along a stalled cold front.   The combination of this front,  plume of tropical moisture, ascent of moist air along the Appalachians,  and slow movement of ex-Lee promises excessively heavy rainfall across the Southeast, and potentially over portions of the Mid Atlantic.  

Here is the morning surface map, showing the front, with ex-Lee embedded in the front over the Gulf Coast:
Here is the morning's 5-day rainfall prediction by NOAA's Hydrometeorological Prediction Center: