Here are a couple of interesting analyses post-mortem on Irene. The first was sent to me by UMBC Ph.D. student Aaron Poyer, who is in my research group studying severe storms. This is the 7-day rain accumulation that brackets the storm's trek up the Eastern Seaboard. The swath of red and purple tells the story - with 15"-20" across eastern North Carolina. Keep in mind that these are early radar estimates and these maps will be refined over time. I will post analyses that use rain gauge data as they become available. Click on this image to see more detail.
Here is a more regionally-focused rain map released by NWS Washington-Baltimore:
For comparison, here is the rain accumulation map for Floyd (1999), for which readers of this blog know I have made a rainfall analogy:
However, while the track and rain are very similar, it is important to bear in mind that Floyd hit as a Cat 2, and evolved in a different manner than Irene. Floyd underwent a classic extratropical transition across the Mid Atlantic, while Irene's was delayed until reaching New England. But I find it very interesting that the rain patterns and intensities came out quite similar.
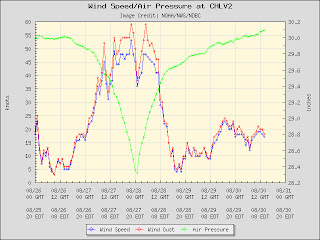
This next figure was sent to my by Ray Hoff, UMBC Physics Professor, who received it from a colleague of his at Johns Hopkins. The graph shows a dramatic time series of pressure and wind, based on 1-minute surface observations, collected at NOAA's Chesapeake Bay Lighthouse. The lighthouse had a very close encounter with Irene's center. The data have not been quality controlled, but the impacts are quite apparent.
The pressure trace is classic hurricane, featuring an exponential decrease and rise. The storm's central region shows a sharp drop in wind speed at the time of minimum surface pressure. Peak eyewall winds are symmetric before and after center passage...keep in mind that 60 kts equates to about 70 mph. The fall off in wind (second wind) as the storm retreated unfolded much faster than the wind rise (first wind) as the storm approached. This is interesting because the pressure trace rise and fall is perfectly symmetric.
Since this is a water station, we wouldn't expect to observe a large gust factor (increase in gust speed over 1-min sustained winds). For the Irene trace, this is generally the case, except during eyewall passage, when gust factor became more significant. As the sustained winds increased, so did the turbulence. I wonder if the lighthouse structure itself generated the observed turbulence? This suggests just how hard it is to get clean measurements of a meteorological phenomenon.
Here is a final figure, provided by NWS Washington/Baltimore, that maps the most extreme wind gusts across our region. There is a gradient in winds, from NW to SE, with the strongest gusts (65-70 mph) over Calvert and St. Marys Counties, which were closer to the track of the storm than Baltimore County. The pocket of higher winds through Montgomery, Frederick and Carroll Counties (50-55 mph) is interesting; I would not have anticipated this ahead of time, given the more inland location of this region.


Oooh, I'm famous now ;)
ReplyDelete