This dramatic image shows Hurricane Katia at Cat 2 intensity in the Atlantic and the post-tropical remnants of (former) Tropical Storm Lee along the Gulf Coast. This is a false-color infrared satellite image from Sunday, September 4; red colors highlight the tallest cloud tops. There is quite a dramatic difference in the structure of these two tropical tempests. Katia is very compact with an enormous, central cluster of deep thunderstorms - called a convective burst. Ex-Lee, on the other hand, is much more sprawling and asymmetric. The center is somewhat open, with dry air off the continent sweeping into the center from the west. A rain band containing intense thunderstorms lies over the Gulf of Mexico. Rain bands such as these have been repeatedly moving northward across the coastal states, bringing episode after episode of heavy tropical rains.
As of this morning, Katia is expected to recurve away from the U.S. East Coat and accelerate toward the northeast, later in the week. The post-tropical remnants of Lee are predicted to move slowly northward along the Eastern Seaboard through the week. The remnants will approach the Mid Atlantic, advancing along a stalled cold front. The combination of this front, plume of tropical moisture, ascent of moist air along the Appalachians, and slow movement of ex-Lee promises excessively heavy rainfall across the Southeast, and potentially over portions of the Mid Atlantic.
Here is the morning surface map, showing the front, with ex-Lee embedded in the front over the Gulf Coast:
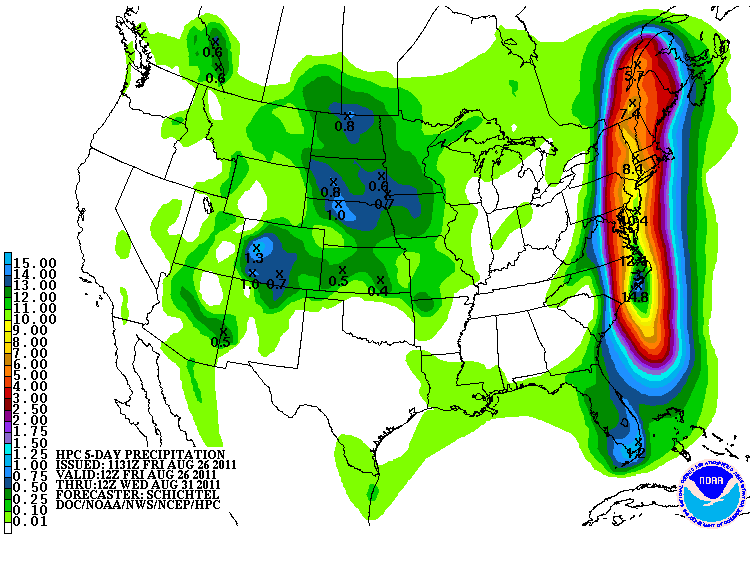
Here is the morning's 5-day rainfall prediction by NOAA's Hydrometeorological Prediction Center:
Monday, September 5, 2011
Wednesday, August 31, 2011
Further Analysis of Irene's Impacts On The Mid-Atlantic
Here are a couple of interesting analyses post-mortem on Irene. The first was sent to me by UMBC Ph.D. student Aaron Poyer, who is in my research group studying severe storms. This is the 7-day rain accumulation that brackets the storm's trek up the Eastern Seaboard. The swath of red and purple tells the story - with 15"-20" across eastern North Carolina. Keep in mind that these are early radar estimates and these maps will be refined over time. I will post analyses that use rain gauge data as they become available. Click on this image to see more detail.
Here is a more regionally-focused rain map released by NWS Washington-Baltimore:
For comparison, here is the rain accumulation map for Floyd (1999), for which readers of this blog know I have made a rainfall analogy:
However, while the track and rain are very similar, it is important to bear in mind that Floyd hit as a Cat 2, and evolved in a different manner than Irene. Floyd underwent a classic extratropical transition across the Mid Atlantic, while Irene's was delayed until reaching New England. But I find it very interesting that the rain patterns and intensities came out quite similar.
This next figure was sent to my by Ray Hoff, UMBC Physics Professor, who received it from a colleague of his at Johns Hopkins. The graph shows a dramatic time series of pressure and wind, based on 1-minute surface observations, collected at NOAA's Chesapeake Bay Lighthouse. The lighthouse had a very close encounter with Irene's center. The data have not been quality controlled, but the impacts are quite apparent.
The pressure trace is classic hurricane, featuring an exponential decrease and rise. The storm's central region shows a sharp drop in wind speed at the time of minimum surface pressure. Peak eyewall winds are symmetric before and after center passage...keep in mind that 60 kts equates to about 70 mph. The fall off in wind (second wind) as the storm retreated unfolded much faster than the wind rise (first wind) as the storm approached. This is interesting because the pressure trace rise and fall is perfectly symmetric.
Since this is a water station, we wouldn't expect to observe a large gust factor (increase in gust speed over 1-min sustained winds). For the Irene trace, this is generally the case, except during eyewall passage, when gust factor became more significant. As the sustained winds increased, so did the turbulence. I wonder if the lighthouse structure itself generated the observed turbulence? This suggests just how hard it is to get clean measurements of a meteorological phenomenon.
Here is a final figure, provided by NWS Washington/Baltimore, that maps the most extreme wind gusts across our region. There is a gradient in winds, from NW to SE, with the strongest gusts (65-70 mph) over Calvert and St. Marys Counties, which were closer to the track of the storm than Baltimore County. The pocket of higher winds through Montgomery, Frederick and Carroll Counties (50-55 mph) is interesting; I would not have anticipated this ahead of time, given the more inland location of this region.
Here is a more regionally-focused rain map released by NWS Washington-Baltimore:
For comparison, here is the rain accumulation map for Floyd (1999), for which readers of this blog know I have made a rainfall analogy:
However, while the track and rain are very similar, it is important to bear in mind that Floyd hit as a Cat 2, and evolved in a different manner than Irene. Floyd underwent a classic extratropical transition across the Mid Atlantic, while Irene's was delayed until reaching New England. But I find it very interesting that the rain patterns and intensities came out quite similar.
This next figure was sent to my by Ray Hoff, UMBC Physics Professor, who received it from a colleague of his at Johns Hopkins. The graph shows a dramatic time series of pressure and wind, based on 1-minute surface observations, collected at NOAA's Chesapeake Bay Lighthouse. The lighthouse had a very close encounter with Irene's center. The data have not been quality controlled, but the impacts are quite apparent.
The pressure trace is classic hurricane, featuring an exponential decrease and rise. The storm's central region shows a sharp drop in wind speed at the time of minimum surface pressure. Peak eyewall winds are symmetric before and after center passage...keep in mind that 60 kts equates to about 70 mph. The fall off in wind (second wind) as the storm retreated unfolded much faster than the wind rise (first wind) as the storm approached. This is interesting because the pressure trace rise and fall is perfectly symmetric.
Since this is a water station, we wouldn't expect to observe a large gust factor (increase in gust speed over 1-min sustained winds). For the Irene trace, this is generally the case, except during eyewall passage, when gust factor became more significant. As the sustained winds increased, so did the turbulence. I wonder if the lighthouse structure itself generated the observed turbulence? This suggests just how hard it is to get clean measurements of a meteorological phenomenon.
Here is a final figure, provided by NWS Washington/Baltimore, that maps the most extreme wind gusts across our region. There is a gradient in winds, from NW to SE, with the strongest gusts (65-70 mph) over Calvert and St. Marys Counties, which were closer to the track of the storm than Baltimore County. The pocket of higher winds through Montgomery, Frederick and Carroll Counties (50-55 mph) is interesting; I would not have anticipated this ahead of time, given the more inland location of this region.
Sunday, August 28, 2011
August 28, 2011 After The Storm: Analysis of Wind and Rain
Surface Analysis, 8 AM EDT: The storm's peak winds and rain were exiting Baltimore at this time. The heavy rain shield remained highly asymmetric, concentrated west and north of center...as is typical for tropical systems undergoing extratropical transition. Dry air off the U.S. mainland was being swept into the southern half of Irene, evaporating rain and clouds there. The stationary front - initially over the Appalachians - began merging with the large wind circulation.
Regional Scale Surface Analysis: This short movie loop shows the extremely large footprint of the pressure field, and intense pressure gradient. The radar is superimposed on the pressure field, so you can watch both features co-evolve. The loop shows hourly fields from 10 pm EDT on 27 August through 6 AM 28 August.
Rain Accumulation: Here are two scales of charts: Regional scale and local scale. Both maps are derived from radar estimates. These totals have yet to be compared with gauge estimates. Extreme point estimates may not be accurately measured by radar. But in general, the rain accumulation agrees quite well with the predictions for our region.
Winds: Shown here are several time series analyses of hourly winds. The graph below shows the sustained winds, in mph, at three stations: Dulles (IAD), Baltimore (BWI) and Washington Reagan (DCA). DCA was the winner with highest sustained wind, which peaked above 40 mph at 1 AM. I constructed these graphs very quickly...the number "1" across the bottom starts the graph at 9 AM on August 27. The observations are hourly and end at 11 AM this morning.
Here are similar plots but comparing sustained wind vs. peak gust (mph) at each of the three airports. The time convention is the same as described above. At BWI, the peak gust was 51 mph at midnight. In the BWI plot, you can see evidence of higher gusts when multiple rain bands moved through. The highest gust was at DCA - 57 mph at 1 AM.
Wind Damage: Here are utility outage maps I grabbed off the web at 9 AM this morning. Outages were most extensive along and east of I-95...closer to Irene's center of circulation.
Regional Scale Surface Analysis: This short movie loop shows the extremely large footprint of the pressure field, and intense pressure gradient. The radar is superimposed on the pressure field, so you can watch both features co-evolve. The loop shows hourly fields from 10 pm EDT on 27 August through 6 AM 28 August.
Rain Accumulation: Here are two scales of charts: Regional scale and local scale. Both maps are derived from radar estimates. These totals have yet to be compared with gauge estimates. Extreme point estimates may not be accurately measured by radar. But in general, the rain accumulation agrees quite well with the predictions for our region.
Winds: Shown here are several time series analyses of hourly winds. The graph below shows the sustained winds, in mph, at three stations: Dulles (IAD), Baltimore (BWI) and Washington Reagan (DCA). DCA was the winner with highest sustained wind, which peaked above 40 mph at 1 AM. I constructed these graphs very quickly...the number "1" across the bottom starts the graph at 9 AM on August 27. The observations are hourly and end at 11 AM this morning.
Here are similar plots but comparing sustained wind vs. peak gust (mph) at each of the three airports. The time convention is the same as described above. At BWI, the peak gust was 51 mph at midnight. In the BWI plot, you can see evidence of higher gusts when multiple rain bands moved through. The highest gust was at DCA - 57 mph at 1 AM.
Wind Damage: Here are utility outage maps I grabbed off the web at 9 AM this morning. Outages were most extensive along and east of I-95...closer to Irene's center of circulation.
Saturday, August 27, 2011
Aug 27, 2011 6 PM: Irene Weakens to 80 mph But Moving Slowly
The 5 PM update from the Hurricane Center has the storm moving slowly N-NE at about 14 mph with sustained winds of 80 mph. Irene is predicted to be directly over Ocean City at 2 AM, also the time when maximum winds (sustained near 40 mph) will be impacting the Baltimore region.
Here is the surface weather map at 2 PM today, showing the large, asymmetric and mainly inland rain shield. Note that while Irene is likely pulling in dry air off the U.S. along its southern side (which is helping to weaken the storm), it is not interacting directly with the stationary front (along the Appalachians), as I thought might happen. It is also not fully embedded in the jet stream trough coming through the Great Lakes. Thus, extratropical transition - a process by which tropical cyclones acquire weather fronts and morph into an extratropical cyclone - may not occur until the storm is over New England.
The final image from late this afternoon shows the rainfall overlaid on top of the detailed surface pressure distribution. Note the intense pressure gradient, and the enormous size of the pressure field. A note about the winds: The surface winds to the left of track, over land, are significantly weaker than right of track, over water. This large asymmetry is a consequence of land friction, which slows the winds, and the motion of the storm. However, just a few thousand feet above the surface, the winds are not slowed by friction. These strong winds are brought down in occasional pulses to the surface within spiral rain bands. Corridors of intense wind gusts tend to occur within the strongest rain bands. This process contributes to the localized nature of most intense wind damage in a hurricane over land, which tends to be streaky in nature.
![]() |
| Hurricane Center Irene position at 2 AM Saturday |
Here is the surface weather map at 2 PM today, showing the large, asymmetric and mainly inland rain shield. Note that while Irene is likely pulling in dry air off the U.S. along its southern side (which is helping to weaken the storm), it is not interacting directly with the stationary front (along the Appalachians), as I thought might happen. It is also not fully embedded in the jet stream trough coming through the Great Lakes. Thus, extratropical transition - a process by which tropical cyclones acquire weather fronts and morph into an extratropical cyclone - may not occur until the storm is over New England.
![]() |
| Surface weather map at 2 pm Saturday |
The final image from late this afternoon shows the rainfall overlaid on top of the detailed surface pressure distribution. Note the intense pressure gradient, and the enormous size of the pressure field. A note about the winds: The surface winds to the left of track, over land, are significantly weaker than right of track, over water. This large asymmetry is a consequence of land friction, which slows the winds, and the motion of the storm. However, just a few thousand feet above the surface, the winds are not slowed by friction. These strong winds are brought down in occasional pulses to the surface within spiral rain bands. Corridors of intense wind gusts tend to occur within the strongest rain bands. This process contributes to the localized nature of most intense wind damage in a hurricane over land, which tends to be streaky in nature.
![]() |
| Rainfall and pressure field at 5 pm Saturday |
Aug 27, 2011 11 AM: Irene's Predicted Baltimore Impacts Are On Target
First, let's look at the 10 AM radar image of the storm. The eye is making contact with North Carolina's Outer Banks. The distribution of heavy rain is asymmetric, with heaviest amounts on the northwest side. This distribution is typical of storms that move into the Mid Atlantic. The heavy rain shield will continue to move north and west through the morning and afternoon, enveloping the major cities (DC, Baltimore, Philadelphia, NYC). Periods of heavy rain will alternate with lulls as individual rain bands sweep through. Maximum rains of 10"-12" are expected along a narrow stripe that extends up the center of the Delmarva, southern Maryland, Delaware, New Jersey and NYC - essentially along the projected storm track. Several inches are anticipated locally in Baltimore.
Hazards: These maps from NWS Washington-Baltimore office are shown below. The reasoning has not changed much since yesterday's post. Note that hazards are not shown east of the Chesapeake Bay as this region is not covered by NWS Washington-Baltimore. Timing is such that the most intense wind and rain are expected overnight. Conditions improve steadily through the day on Sunday.
11 AM Hurricane Center Storm Update and Track: The storm is down to 85 mph sustained winds - a low end Cat 1 storm. Continued slow weakening is expected. The storm is feeling impacts of wind shear and dry air off the mainland. As the storm passes east of Baltimore tonight, the intensity should decrease down to 75 mph, then weaken to tropical storm Sunday morning. Below is the track and radius of expected tropical storm wind at 8 pm tonight (Stormpulse):
![]() |
| 10 AM radar (Weathertap) |
Hazards: These maps from NWS Washington-Baltimore office are shown below. The reasoning has not changed much since yesterday's post. Note that hazards are not shown east of the Chesapeake Bay as this region is not covered by NWS Washington-Baltimore. Timing is such that the most intense wind and rain are expected overnight. Conditions improve steadily through the day on Sunday.
11 AM Hurricane Center Storm Update and Track: The storm is down to 85 mph sustained winds - a low end Cat 1 storm. Continued slow weakening is expected. The storm is feeling impacts of wind shear and dry air off the mainland. As the storm passes east of Baltimore tonight, the intensity should decrease down to 75 mph, then weaken to tropical storm Sunday morning. Below is the track and radius of expected tropical storm wind at 8 pm tonight (Stormpulse):
Friday, August 26, 2011
Aug 26, 2011 5:30 PM Irene Impacts To Come A Bit Sooner
At 5 pm, Irene has weakened to 100 mph. This is weaker than what was forecast yesterday and the storm is now rated a low-end Category 2. The Hurricane Center reports that the storm's inner core has lost its structure, and strong winds are impinging on the storm at upper levels. Thus, the storm is likely experiencing the effects of increased wind shear, cooler water, and perhaps dry air entering along its west side. Any opportunity for re-intensification seems to be dwindling.
However, Irene remains a very large storm, with tropical storm winds extending 250 miles east of center, and a large core of hurricane-force winds. Irene is still a very potent, serious system, and will remain so, for at least the next 48-72 hours. In fact, the Hurricane Center cautions us that whether the storm is rated a weak hurricane, or an intense tropical storm...the hazards will remain the same.
The storm is expected to begin accelerating to the north and northeast tomorrow, which will usher in its effects a few hours sooner for the Baltimore region. The worst weather will come Saturday night, and the effects will begin to diminish Sunday morning. The rains will likely end early Sunday, but the winds may take longer to calm down. In fact, even though the storm will be moving away from the region on Sunday afternoon, some of the faster winds at higher levels may mix down to the surface, creating gusty conditions. These winds mix down because of turbulence, which is caused when the Sun warms the surface and the air begins to percolate.
The first image below is a radar snapshot of the storm from late this afternoon, showing outer spiral rain bands scraping North Carolina (courtesy of Weathertap). The second is a special satellite image, which shows the amount of moisture (water vapor) in the atmosphere (courtesy of Weathertap). Notice the very dry air across the southeast U.S., right up along the west side of Irene. The final image shows the Hurricane Center's 5 pm track prediction (Courtesy of Stormpulse). The storm's position is shown at 2 AM Sunday, when Baltimore's weather deteriorates. The storm is predicted to be a weak Cat 1 at this time (80 mph). The outer white semicircle is the predicted radius of tropical storm force wind. Note that Baltimore is right on the edge.
However, Irene remains a very large storm, with tropical storm winds extending 250 miles east of center, and a large core of hurricane-force winds. Irene is still a very potent, serious system, and will remain so, for at least the next 48-72 hours. In fact, the Hurricane Center cautions us that whether the storm is rated a weak hurricane, or an intense tropical storm...the hazards will remain the same.
The storm is expected to begin accelerating to the north and northeast tomorrow, which will usher in its effects a few hours sooner for the Baltimore region. The worst weather will come Saturday night, and the effects will begin to diminish Sunday morning. The rains will likely end early Sunday, but the winds may take longer to calm down. In fact, even though the storm will be moving away from the region on Sunday afternoon, some of the faster winds at higher levels may mix down to the surface, creating gusty conditions. These winds mix down because of turbulence, which is caused when the Sun warms the surface and the air begins to percolate.
The first image below is a radar snapshot of the storm from late this afternoon, showing outer spiral rain bands scraping North Carolina (courtesy of Weathertap). The second is a special satellite image, which shows the amount of moisture (water vapor) in the atmosphere (courtesy of Weathertap). Notice the very dry air across the southeast U.S., right up along the west side of Irene. The final image shows the Hurricane Center's 5 pm track prediction (Courtesy of Stormpulse). The storm's position is shown at 2 AM Sunday, when Baltimore's weather deteriorates. The storm is predicted to be a weak Cat 1 at this time (80 mph). The outer white semicircle is the predicted radius of tropical storm force wind. Note that Baltimore is right on the edge.
August 26, 2011 Baltimore's Impacts From Irene Remain On Course
Here is the current surface map (from Intellicast). Irene is most conspicuous, and notice the weather front the storm will interact with:
But there will be other interactions with Irene, including the jet stream level; the storm will become embedded in a trough (region of low pressure) moving towards us from the Great Lakes. Both the front and the trough will energize the storm, even as it is moving over cooler water, and this effect could sustain the storm as it moves into New England, and enhance the rainfall. Here is the forecast map for tomorrow (Saturday) evening:
Notice how the weather front begins to reorient along the coastline. As tropical humidity is lifted along the front, very heavy rains will develop.
All of this is part of the complex process called extratropical transition - a tropical storm begins to lose some of its tropical identity, and take on characteristics of a mid-latitude weather systems.
Now let's look at the likely impacts - using NWS graphics.
Official Watches and Warnings - As of 10 AM today:
Winds: As of 10 AM today:
Baltimore is on the edge of low and moderate wind impacts...therefore a slight shift in storm track or change in storm intensity will change the impact level. We are expecting sustained winds 30-40 mph over Baltimore's metro west, 35-45 mph sustained over metro east, with higher gusts.
Rainfall: We've recently had considerable rain, so soils are moist. Given the intense rain rates in hurricane rain bands, and frequent rain band passage, it won't take much to cause local flash flooding. I expect 2"-4" broadly over Baltimore, more to the east (3"-6"), much more over the Delmarva (12" or more) - click on the map below to zoom in:
Storm Surge on the Bay: This is complicated somewhat by the fact that wind direction during the strong wind period will be shifting throughout the event. Initially, northeasterly winds may push water along the Bay's western shore, through the day on Saturday. Saturday night and early Sunday morning, the strongest winds blow from the north, pushing water down and out of the Bay. During the day on Sunday, the winds switch to westerly and begin to slacken, but this may lead to flooding of the Bay's eastern shore for a time.
Timing of Impacts: Irene will likely be a Cat 1 storm as the core passes up Maryland's coastline tomorrow night and early Sunday. It has a large circulation, so the weather impacts will take time to unfold, and time to wind down. Rains will begin tomorrow afternoon. The most intense period of rain and wind will be after midnight Saturday. But the storm is progressive i.e. it will not stall, as it will get pushed along by south-southwesterly winds in the jet stream; in fact, it will begin to accelerate toward New England.
But there will be other interactions with Irene, including the jet stream level; the storm will become embedded in a trough (region of low pressure) moving towards us from the Great Lakes. Both the front and the trough will energize the storm, even as it is moving over cooler water, and this effect could sustain the storm as it moves into New England, and enhance the rainfall. Here is the forecast map for tomorrow (Saturday) evening:
Notice how the weather front begins to reorient along the coastline. As tropical humidity is lifted along the front, very heavy rains will develop.
All of this is part of the complex process called extratropical transition - a tropical storm begins to lose some of its tropical identity, and take on characteristics of a mid-latitude weather systems.
Now let's look at the likely impacts - using NWS graphics.
Official Watches and Warnings - As of 10 AM today:
Winds: As of 10 AM today:
Baltimore is on the edge of low and moderate wind impacts...therefore a slight shift in storm track or change in storm intensity will change the impact level. We are expecting sustained winds 30-40 mph over Baltimore's metro west, 35-45 mph sustained over metro east, with higher gusts.
Rainfall: We've recently had considerable rain, so soils are moist. Given the intense rain rates in hurricane rain bands, and frequent rain band passage, it won't take much to cause local flash flooding. I expect 2"-4" broadly over Baltimore, more to the east (3"-6"), much more over the Delmarva (12" or more) - click on the map below to zoom in:
Storm Surge on the Bay: This is complicated somewhat by the fact that wind direction during the strong wind period will be shifting throughout the event. Initially, northeasterly winds may push water along the Bay's western shore, through the day on Saturday. Saturday night and early Sunday morning, the strongest winds blow from the north, pushing water down and out of the Bay. During the day on Sunday, the winds switch to westerly and begin to slacken, but this may lead to flooding of the Bay's eastern shore for a time.
Timing of Impacts: Irene will likely be a Cat 1 storm as the core passes up Maryland's coastline tomorrow night and early Sunday. It has a large circulation, so the weather impacts will take time to unfold, and time to wind down. Rains will begin tomorrow afternoon. The most intense period of rain and wind will be after midnight Saturday. But the storm is progressive i.e. it will not stall, as it will get pushed along by south-southwesterly winds in the jet stream; in fact, it will begin to accelerate toward New England.
Subscribe to:
Posts (Atom)