Thursday, December 8, 2011

Dec 7, 2011: Floods, High Winds, Power Out For Thousands

It's just another stormy, early winter day in the Mid Atlantic and New England!

The culprit, as is typical for this region and this time of year, was a compact and powerful extratropical cyclone that developed and amplified along a stationary front draped through the Mid Atlantic.

Synoptic surface chart at 7 pm, December 7 (unisys.com)

Yes, that is a severe thunderstorm watch box (yellow quadrilateral) over southeast Virginia.  Although no tornadoes developed, there were about 40 reports of wind damage due to severe thunderstorms.

The storm had a very sharply demarcated warm and cold side.  Washington-Baltimore was fortunate to remain in the warm sector of this system throughout the duration.  The flip side is that rainfall in excess of three inches fell across most of our region, setting new all-time December 1-day rainfall records at the area's three airports.  Despite the threat of 1"-3" of heavy wet snow, the moisture and energy exited our region faster than sub-freezing air could arrive from the northwest.  Heavy rain totals were due to five factors:  (1) the overall slow movement of the stationary front;  (2) training (repeated passage) of storm cells over the same locations;  (3) high precipitable water content (abundant Atlantic moisture feeding into the storm);  (4) very energetic conditions in the upper atmosphere that favored vigorous ascent of air;  and (5) strongly "frontogenetic" conditions i.e. a rapidly intensifying front as the wave of low pressure deepened.


Radar view of the storm, showing a plume of heavy rain extending across the region.  Embedded reds indicate thunderstorms.  Blue colors indicate moderate snowfall (weathertap.com)

Radar-derived rain accumulation for the December 7 storm (NOAA)
Once the precipitation exited (around 11 pm), the next hazard was high wind.  Winds gusted to 46 mph at BWI at 3 AM.   Saturated soils combined with these strong winds led to numerous treefalls through the region.   Many thousands lost power in the early morning hours.    Power outages numbered in the tens of thousands from Virginia through New England.  The high winds were the consequence of an intense pressure gradient between the departing storm and an approaching cell of high pressure.   This created a pressure surge during the early morning hours:

Pattern of isobars (black solid lines) - notice the extremely large pressure gradient over western Maryland and West Virginia.  Red solid lines indicate regions where the surface pressure is abruptly rising (NWS).

The final image (below) shows that great variety of weather watches and warnings that were posted for our region, at the height of the storm.  It is quite clear that Washington-Baltimore was on the thin dividing line between cold and warm weather hazards.  Whenever you see lots of different colors such as this, look out!

Wednesday, November 23, 2011

Nov 23, 2011: Autumn Cyclone Brings Flooding, High Winds To Mid Atlantic

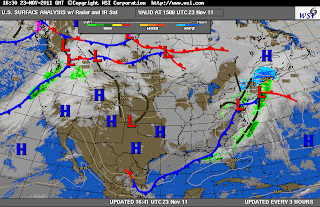
As is typical for late November, strong disturbances called extratropical cyclones frequently pass through our region.  On November 22-23, periods of moderate rain combined with dense fog, followed by unseasonably mild temperatures and then a period of brisk winds as skies cleared.  This sequence of weather describes the classic passage of a wave cyclone through the Baltimore region.  Thirty of more of these cyclones traverse our region in the course of a typical year, although most are not especially intense.

The sequence of three surface weather charts below (courtesy of Intellicast) shows a warm front to the south of Baltimore on the evening of November 22 (red scalloped line).   An extensive canopy of moderately heavy rain had overspread the region, in advance of the front, during the daytime.  Dense patches of fog developed during the evening as the warm front approached from the south.  This type of frontal fog is a common feature along warm fronts. 


The warm front moved north through Baltimore after midnight, and quite paradoxically, temperatures began to rise into the lower 60's after midnight!   This occurred as winds turned from the south and ushered in a warm air mass from the south, within the cyclone's warm sector.  A band of heavy showers swept through Baltimore in the early morning hours, within the warm sector and ahead of the cold front.  

Then, around Noon on November 23, the cold front pushed through from the west.   This marked the arrival of a dry air mass, clearing skies, and strong winds.  Paradoxically again, even with the early afternoon Sun, temperatures rapidly fell through mid-afternoon as a cold Canadian air mass arrived from the west and north.

 
The meteogram below (from Unisys) shows an atypical flip-flop between nightly minimum and daily maximum temperatures.   This meteogram, from Dulles airport, shows temperature (green trace, upper panel) on November 22 and part of the 23rd.  Note the steadily warming temperatures after midnight (05 UTC);  the warmest temperature on November 23 actually came during the morning (61 F at 9 AM).  The rapid drop in temperature through the afternoon (down to 51 F at 1 pm) followed the cold front.  Wave cyclones, with their strongly contrasting temperature fields, frequently modulate the expected diurnal cycle of afternoon high temperature and nighttime low temperature.


Prolonged moderate rainfall across central Maryland on Nov 22-Nov 23 lead to 2"-3" of accumulated rain and moderate flooding of the Monocacy River near Frederick, MD (below):

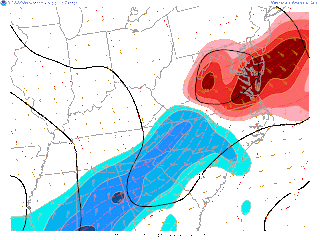
The other weather hazard of note was strong wind behind the cold front, particularly at the high elevations west and south of Baltimore.  At the area airports (DCA, BWI, IAD) winds gusted to nearly 40 mph as the cold front swept through the region.   These high winds were the result of a strong pressure gradient (pressure surge) behind the cold front (isobars are shown as solid black lines):


 The NWS issued a Wind Advisory for counties immediately west of Baltimore, and a High Wind Warning for counties in the mountains of central Virginia:


Since friction reduces wind speed at Earth's surface, the high elevations of the Appalachians (3000'-4000') frequently experience stronger winds when the pressure gradient is intense.  A High Wind Warning is issued when gusts are expected to exceed 50 mph.  In the NWS maximum gust forecast for the afternoon,  windy ridge tops show up quite dramatically.  Also note the high wind gusts (nearly 50 mph) predicted for the middle of the Chesapeake Bay - a location where the wind accelerates across the extensive, flat water surface.

Tuesday, November 8, 2011

October 29-30 Snowstorm Ranked a NESIS Category 1

The Northeast Snowfall Impact Scale (NESIS) is a recently developed metric for assessing the geographical impact of large East Coast snowstorms.  Statistically, it is computed by examining the correlation between population density and snow footprint (areal coverage, depth of snow).  Widespread snowstorms of significance in the Northeast Corridor are assigned a NESIS score, and ranked on a scale from 1 to 5 in terms of overall impact.  This enables individual snowstorms to be placed in a historical context.   The NESIS is computed in the weeks following a snowstorm by NOAA.   NESIS categories range from 1, Notable, to 5, Extreme. 

The extremely early season Nor'easter of October 29-30 was determined to be a NESIS Category 1.   This score is based strictly on population and snowfall.  NESID does not provide an an assessment of infrastructure disruption, nor of societal disruption and hardship, as was generated by 3+ million power outages from downed tree limbs. 

In spite of being rated near the "bottom of the heap", in terms of all-time great snowstorms, what is remarkable is that no snowstorm in the NESIS Top 45 (Northeast urban corridor) has ever occurred earlier than December!   The large majority of historical snowstorms occur in January-February. 

Here is the official snow accumulation map from October 29-30 and the NESIS score as provided by NOAA:

Thursday, November 3, 2011

October 29, 2011: October Nor’easter, Trick or Treat?

This blog was written by Alexandra St. Pe with contributions from Professor Storm.


Winter storm headlines came earlier than many expected this year and transformed Halloween traditions of spooky sights into winter wonderlands across portions of the Mid-Atlantic and Northeast states. Forecasters first became apprehensive about what could unfold during the holiday weekend when weather forecast models indicated the formation of a rapidly intensifying low pressure system tracking northeast along the East coast. This system had similar characteristics of a classic “Nor’easter” weather system that typically occur in the late winter season (January/February). A Nor’easter or coastal low is infamous for ushering in an exceptionally cold Arctic air mass on northeasterly winds, and is often accompanied by powerful winds and heavy snow as cold and warm air masses converge. With tree foliage still turning colors, a Nor’easter in late October would not bode well for tree limbs and widespread power outages became a major concern.


Critical Temperature Profiles

As a low pressure system approached from the Carolinas, a second system began to spin off the Atlantic coast. Even though the synoptic conditions were aligning for the development of a Nor’easter, there was still much uncertainty about the characteristics of the air masses involved. Weather forecast models disagreed on the chilliness of the air mass moving towards the coast and made it extremely difficult for forecasters to predict where snow verses rain would fall.   In addition, slight variations in storm track by as little as 20-30 miles would make a big difference in who received heavy rain, and who received heavy snow.


During the morning of the event, the 8am Dulles International Airport  (IAD) temperature profile from weather balloon data hugged the freezing line. This profile suggested that the atmosphere east of the Blue Ridge Mountains was only slightly cold enough to support a snow event. The red arrow in the figure below points to the temperature (red) and dew point temperature (green) vertical profiles and the black dashed-line highlights the freezing line. A warmer air mass being ushered in the lower levels of the atmosphere is also shown in the black box.

Baltimore was spared heavy snow because in October, the Atlantic water temperature is still quite warm, and kept temperatures just above freezing in the critical snow-making layer in the clouds at 5,000 ft.  The image below shows the region of warming (called warm air advection, red colors) in the lower atmosphere, as southeasterly winds moved warm Atlantic air in over the Baltimore region:

 
Cold enough for snow?  Forecast Models Help Solve The Dilemma

Due to widespread forecast disparity for snow accumulations east of the Blue Ridge, (NAM model forecasting > 10 inches, GFS model forecasting a < 1 inch), forecasters relied on the High Resolution Rapid Refresh (HRRR) model guidance. This experimental model has better temporal and spatial resolution than the aforementioned operational models. After forecasters analyzed the HRRR’s forecast for a swath of heavy snow accumulating over the next 15 hours along a southwest-northeast axis, confidence grew that this would be a significant snow event to the north of the Mason-Dixon Line.

By mid-afternoon, the coastal low pressure system began to strengthen as it tracked northeasterly, parallel to the Mid-Atlantic coast.  Cold air wrapped around the backside of the counterclockwise spinning system and collided with relatively warm air over the Atlantic coast. The converging air masses induced a nebulous rain-snow transition line and therefore heavy bands of mixed precipitation along the I-95 corridor.  

This weather radar snapshot captures the very narrow rain-snow line that set up just to the north and west of Baltimore:


Periods of moderate rain during the morning hours gave way to intense episodes of sleet during the afternoon, and finally moderately heavy snow that tapered to flurries by late afternoon.  The transition occurred as the low moved to the northeast, wrapping in a cold air mass from the north on its back side.

Gusty Winds

The increasing pressure gradient between this system and an approaching high pressure system from the west kicked off gusty winds throughout the day as well.   Because of exceptionally vigorous jet stream energy above the storm, the Nor’easter rapidly deepened, becoming what is called a “meteorological bomb”.  The powerful winds reduced visibility conditions to less than 3 miles at BWI airport and held the “feels-like” or wind chill temperature below freezing for most of the day! (black box = temperature, blue box = wind chill temperature, red box = wind gusts and visibility).  

 
Winds were much more significant to the northeast of Baltimore, where gusts in the 50-60 mph were commonplace along the New England coast:


First Freeze of the Season

After the winter storm headlines expired, strong northwest flow behind the system ushered in the chilliest air mass of the season and prompted NWS Sterling forecasters to issue a Freeze Warning for the Baltimore-Washington corridor Saturday night. The Dulles weather balloon data at 8pm indicated a much cooler temperature profile compared to the morning profile. In the figure below, the red arrow points to the temperature profile well below the black-dashed freezing line and the chilly northerly winds in the lower atmosphere are shown in the black box.

 
Accumulated Snowfall

According to unofficial observations submitted to the NWS office in Sterling, storm total snowfall varied from a measured trace in eastern Maryland to nearly 12 inches across west and northern portions of the state. The HRRR 15 hour snow accumulation forecast listed above verified quite well with the heaviest snow accumulation along a southwest-northeast axis.  The heavy snowfall across the W. Va panhandle and western Maryland reflects mainly below freezing temperatures prevalent at the higher elevations.  The heavy snow across New England reflects a combination of higher elevation temperatures, and below-freezing air transported toward the coast by the low.

 
Snow from Space

Finally we see a snapshot from the MODIS sensor onboard NASA’s Aqua satellite. This image was captured Sunday, the day after the event, and shows only the remnants of the rare October Nor’easter.


Monday, October 17, 2011

October 13 2011: Mini Severe Weather Outbreak in the Mid Atlantic

On Thursday, October 13, a small outbreak of tornadoes and severe thunderstorms developed during the afternoon hours.  There were several sightings of funnel clouds and tornadoes across Northern Virginia.  The image below shows reports of tornadoes received by the NOAA Storm Prediction Center (tornado locations are shown as small red triangles):
This was a rapidly developing severe weather situation, and unusual for its small geographic coverage.  The surface weather map (below) shows several classic elements came together to produce rotating, supercell thunderstorms.   Warm, humid air was being lifted along a warm front draped from west to east across Northern Virginia, assisted by air converging into a region of low pressure approaching from over West Virginia.   The small pocket of warm, humid air - a moderately unstable air mass - is shown by the shaded magenta region.  This pocket was located just along and to the south of the warm front.   Warm and humid air was being transported toward the warm front by low-level southeasterly flow (thin orange arrow).
The region was thus primed for the development of thunderstorms.  However, supercell thunderstorms, which contain a vertical core of rotating wind, acquire their rotation because of wind shear.  Wind shear is the change in wind speed and direction with increasing altitude.   Tornadoes develop when low-level winds both increase in speed, and veer - that is, turn clockwise - with height.  The large yellow arrow shows the wind direction at 18,000 ft, from the southwest, and stronger than at the surface.   A more detailed view of these veering and strengthening winds is provided by an instrument called a wind profiler, located at Beltsville, MD:
Warm fronts are common breeding grounds for tornadoes in the Mid Atlantic.  The winds are often east-southeasterly close to the frontal boundary, along the surface, but rapidly veer to southwesterly winds overhead. 

Additional, vigorous uplift of air was generated by an approaching trough in the jet stream.  The trough took on a "negative tilt", which means that its axis (shown below by the dotted magenta arrow) is oriented from NW to SE, as opposed to N-S.   When a trough becomes negatively tilted, the upward flow of air intensifies downstream of the trough (in the case, across the Mid Atlantic).  This helps to invigorate thunderstorms erupting upward from the unstable air mass.

A radar loop of the heavy thunderstorms moving through the DC-Baltimore region is shown below:


But tornadoes were not the only severe weather story this day.  Intense rains accompanied the strong thunderstorms.  In some cases, repeated movement of cells over the same location, called "echo training", dumped 2"-3" in some locales.   To generate flash flooding, the air mass must be very moist.  The map of "total precipitable water" (a measure of the amount of water vapor in the air column) below indicates a plume of 1.5"-2.0" values south of the warm front.  This very humid Atlantic air was streaming toward the warm front at low levels, where it became lifted into narrow corridors.

A radar loop showing these narrow corridors of heavy rain - the "rain train" - is shown below:

October 12, 2011: Late Fall-Like Clouds and Rain Blanket The Mid-Atlantic


Post written by Alexandra St. Pe.

After a lovely start to the week with clear skies and northeast winds funneling in a cool and dry air mass, the strong high pressure system responsible for the pleasant weather conditions began to exit the Mid-Atlantic region. As the high pressure system traversed the New England states, a low pressure system developed off the Mid-Atlantic coast, locking in an all too familiar southeasterly wind flow infamous for ushering in copious amounts of moisture. 
 
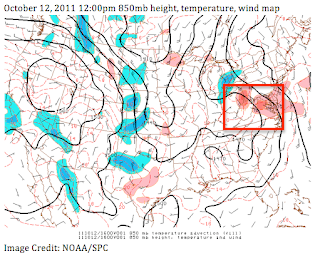
This process is known as Warm Air Advection (WAA) and is often associated with stratiform cloud decks and widespread showers. The weather map below depicts the warmer air (red shaded region) being transported inland on southeasterly winds off the Atlantic.  Stratiform rain refers to light-moderate rain or rain showers that fall over a large area from layered, horizontally extensive cloud layers.  (Convective rain refers to heavy showers and/or thunderstorms forming from deep, isolated clouds).


The development of this low pressure system and co-existing WAA set the stage for an overcast and wet middle of the week as the moist-laden air was forced to lift over a cooler dome of air already in place. This process is often referred to as overrunning - meaning warm, humid air will gently ascend along a sloping layer of cool air at the surface.  The cool air was flowing down the east side of the Appalachians on northeasterly winds at the surface.  The diagram below illustrates this process of warm (less dense) air overriding the cooler (more dense) air.

Overrunning often denotes the beginning of lengthy rain periods as showers can stream along a narrow axis as long as there is a sufficient moist airflow. The 12:00 pm analysis below from the Storm Prediction Center provides evidence of a generous tropical-like plume of moisture with dewpoint temperatures ≥ 64 degrees Fahrenheit stretching along the east coast of the US.

The upper levels of the atmosphere (~ 27,000’) were also conducive for maintaining widespread showers as divergence aloft was occurring over the shower genesis area. Divergence aloft serves as another ‘lifting’ mechanism in the atmosphere and is marked by fast moving winds spreading apart.  When winds spread apart high in the atmosphere, air is drawn up from below to “fill the void”.  The pocket of diverging air over the Mid-Atlantic is outlined by the purple lines below.

NWS Radar Base Reflectivity imagery indicated widespread showers across the Mid-Atlantic by 12:15pm. The light to moderate showers continued throughout the evening until the surface low pressure system finally began to retreat northeast.

Due to the blanket of clouds and showers that persisted Wednesday, temperatures didn’t budge at BWI airport- holding steady at 63 degrees Fahrenheit during the entire day! Note also the light and steady rain that fell during the event.  Accumulations in the immediate DC-Baltimore metro region were few tenths of an inch, but over an inch fell in Central Virginia.

Tuesday, October 4, 2011

October 4, 2011: Never Trust A Cutoff Low!


This piece was written by Ms. Alex St. Pe, Professor Storm's grad student conducting research on severe storms in the UMBC GES program.
 
Star filled skies were visible for the first time in awhile Thursday evening (September 29, 2011) after persistent cloudy conditions and scattered showers exited the region behind a cold front. Unfortunately the clear skies were only temporary, as an upper-level disturbance vigorously dove south into the Ohio River Valley. Forecasters watched closely as the weather models predicted this wouldn’t be an ordinary low pressure system, and likely develop into a “cut-off low” feature. Confidence in a forecast involving a cut-off low is typically low amongst many meteorologists due to the system’s capricious movement and the unreliability of weather forecasting models.

Cut-off lows occur when a trough in the jet stream becomes so highly amplified that it literally pinches off, leaving the spinning low pressure system behind. A cut-off low has the characteristics of an upper-level cold-core center. Because the low is no longer embedded within the jet stream, the spinning whirlpool meanders slowly or becomes stationary.  Associated showers typically form around the center of the low.

 
This past weekend, the Mid-Atlantic region experienced unseasonably cool temperatures, dreary overcast sky conditions and persistent showers in response to a cut-off low meandering towards the east coastline. In order to gain a better understanding of this past weekend’s relentless weather pattern, I will investigate the infamous cut-off low.

Thursday:

On Thursday evening (September 29, 2011) the 300mb pressure (~ 27,000 ft) map indicated strong north/northwesterly winds of approximately 100-120 knots ushering chilly Canadian air southward towards the Great Lakes Region. The pink contours on the map denote regions of “divergence aloft”. Areas of diverging winds at this level in the atmosphere create favorable conditions for the genesis of showers and storms at the surface. 

 
This digging trough within the jet stream was forecast to become a closed upper-level low, or “cut-off low” during the day Friday, before dropping south into the Mid-Atlantic Friday night into Saturday. For this reason, forecasters across the Mid-Atlantic anticipated weekend weather conditions of noticeably cooler temperatures, and scattered showers.

Friday – Saturday:

Friday evening, a surface low-pressure system developed off the Delmarva Peninsula and created light showers ahead of the anticipated main shower event for the weekend.   The surface low helped reinforce cold air arriving from the northwest.

 
On Saturday morning a cooler Canadian type air mass had successfully reached the Mid-Atlantic, with temperatures dropping the lowest for the season yet - the mid-40s. At 8am EDT atmospheric weather balloon data from Dulles International Airport (IAD) suggested a cold, deeply saturated vertical profile as the cut-off low approached the region. The tropopause, which is typically found at much higher altitudes (~12km),  dropped down to an astoundingly low 7.5 km within the cold core of the cutoff vortex.

Notice the surface temperature within the orange circle. The surface temperature at 8am was 51 degrees Fahrenheit and actually dropped throughout the morning (the day’s high temperature, 61 F, occurred just after midnight!) before topping off in the lower 50s by 4pm.

 
By Saturday afternoon (October 01, 2011 3pm EDT) the 500mb (~15,000ft) pressure map indicated a closed circulation around the center of low pressure. The two height contours within the red oval provide evidence of an intense cut-off low over the Mid- Atlantic.


Once displaced from the jet stream’s steering winds, the movement of the cut-off low became very unpredictable. The system began to slowly meander eastward, producing a thick deck of stratus clouds, persistent precipitation, and chilly temperatures. At greater elevations near the Potomac Highlands, even cooler temperatures coupled with persistent precipitation generated a wintry mix along the western slopes of Allegheny Mountains.

Sunday-Monday:

  As the cut-off low continued to spin across the northern Mid-Atlantic Sunday, light precipitation and dense cloud cover held temperatures steady in the mid-upper 40s for most of the day again. The weather system surprised some forecasters when it refused to exit off the coast Sunday, and extended its stay through the beginning of this week. According to the Storm Prediction Center’s 500mb pressure map, strong northwesterly winds  (shaded blue) continued to filter cool air into the Mid-Atlantic area Monday morning. A strong mid-level temperature gradient is also noticeable from the closely spaced red-dashed temperature lines.  Also worth noting is the difference in temperatures over Maryland/Virginia in comparison to Mississippi/Alabama. The cold-core of the cut-off low is clearly visible off the coast of Virginia, defined by the -24 C isotherm – nearly 14 C colder than air over Mississippi.

 
The NWS’s radar loop from the Sterling, Virginia site captured the system’s counter-clockwise flow as it initiated precipitation around its center on Monday. Patches of light-moderate rain were observed to pinwheel counterclockwise around the low’s center all weekend and into the Monday.


The meteogram below (BWI) shows that high temperatures over the weekend were about 20 F colder than average for this time of year – weather more typical of late November – thanks to a very stubborn cutoff low!
 

Monday, September 26, 2011

September 26: First Day of Fall Brings Soaking Rainfall East of Blue Ridge


Professor Storm's Note:  This blog was written by Alexandra St. Pe, who recently received her meteorology degree and has joined Professor Halverson's research group, where she is studying hurricanes and severe storms. 

After a wet and overcast week, the first day of fall (Friday, September 23, 2011) did not bring comfortable fall-like conditions, but rather heavy afternoon rainfall that initiated Flash Flood watches and warnings across the Mid-Atlantic. Interestingly enough these conditions are not caused by a powerful cyclone sweeping through the region, but rather a sluggish frontal boundary stalling just east of the Blue Ridge Mountains. In fact, the main weather system, an upper-level low, remains stalled over the Great Lakes.  The vortex is keeping the Baltimore-Washington corridor under overcast conditions yet again. Below I will break down the factors that precluded Friday’s rain event, discuss the numerical weather model output for the event, then follow up with rainfall accumulations and climatological plots for Baltimore.

Synoptic Set-up:

Beginning overnight Thursday, a deep southerly wind flow ushered in a tropical plume type air mass.  This flow strengthened as the pressure gradient tightened between the deepening upper-level low over the Great Lakes and a building ridge of high pressure over the West Atlantic.

This upper-level feature was coupled within a jet streak (a pocket of localized fast wind embedded within the jet stream), which produced widespread rising air, setting us up for a widespread rain event.

The jet streak is shown by the light blue and turquoise colors in the upper-level analysis below.   This pocket of fast winds was moving around the eastern side of the stationary upper-level vortex parked over the Great Lakes.
 
The Friday early morning analysis (8 EDT) shows a surface trough (dashed yellow line), ahead of a stationary front to the west, stretching from the southern Appalachians northeastward as far north as Massachusetts. With strong southwesterly flow (blue wind barbs) and a moist atmosphere on hand, the frontal boundary enhanced the uplift of air in a north-south ribbon oriented over the Mid Atlantic. The area of precipitation filled in along this boundary throughout the morning as it lifted northward. 
 
Friday morning  (8am EDT) atmospheric weather balloon data indicated that the atmosphere was primed for a heavy downpour as the air remained saturated (indicated by red temperature line and green dew point line overlapping within the lowest 2 km of the atmosphere).
  Another good indicator for heavy rain was the Precipitable Water (PW) value (a measure of the total amount of moisture in the troposphere), which was approaching 2 inches across the region.   Note the tongue of high PW values (dark green shades) extending over the Mid Atlantic, rooted in the tropics, and streaming along the stationary front just to our west.
 
Weather Model Forecasts:

Although the general model consensus was for the axis of most intense rain to align near the I-95 corridor, there was variability in the W-E orientation. Unfortunately numerical weather predication models struggle with precipitation amounts due to resolution constraints. However, the Rapid Update Cycle, which is the most frequently updating and operational weather prediction model, did place a precipitation maximum ending by 2100 UTC (5 pm EDT) of  more than 3 inches across southeast Pennsylvania and across central/western Maryland and Virginia.
 
The NWS was aware that Friday would be an extremely wet day, and issued numerous Flash Flood watches and warnings across the region to prevent hazardous impacts. These watches were necessitated by the recent heavy rains from tropical storms Irene and Lee, which deposited one to two feet of rain across our region.  However, due to limintations in the weather prediction models, NWS graphical forecasts were still a few inches shy of total rainfall accumulation by 8pm EDT.
 
The NWS in Sterling, VA has now released preliminary rainfall accumulations from this event which suggested nearly 4.5 inches around portions of northeast Baltimore County, and barely one inch for most locations in Howard county.

Rainfall Accumulations:

The combination of a strengthening southerly jet, formation of a surface boundary east of the Blue Ridge, and jet streak over the Great Lakes all served to enhance lift and sustain drenching rainfall across the Baltimore – Washington corridor. Below is the total rainfall distribution courtesy of NOAA’s Advanced Hydrologic Prediction Service. It is a 7-Day analysis, but since most of the rainfall over the past 7 days fell on Friday, September 23rd, the most intense rain axis of 2 - 5 inches occurred during Friday’s event. From this analysis, and from the previous discussion, is the distribution of heaviest rainfall a surprise?

As presented in previous blog posts, the question remains: Is there a ‘preferred mode’ that commonly sets up a north-south rain axis of high intensity across the Mid-Atlantic? 
Climate Plots:

Finally, climatology model data suggests that a daily precipitation record was tied at the BWI airport and that this heavy rainfall event, although much shorter in duration, registered single day rainfall totals similar in magnitude to the remnants of Tropical Storm Lee. And as displayed in the final climate plot, both of September’s heavy rainfall events have contributed immensely to the region’s “above normal” climatological precipitation pattern.