Winter storm headlines came earlier than many expected this year and transformed Halloween traditions of spooky sights into winter wonderlands across portions of the Mid-Atlantic and Northeast states. Forecasters first became apprehensive about what could unfold during the holiday weekend when weather forecast models indicated the formation of a rapidly intensifying low pressure system tracking northeast along the East coast. This system had similar characteristics of a classic “Nor’easter” weather system that typically occur in the late winter season (January/February). A Nor’easter or coastal low is infamous for ushering in an exceptionally cold Arctic air mass on northeasterly winds, and is often accompanied by powerful winds and heavy snow as cold and warm air masses converge. With tree foliage still turning colors, a Nor’easter in late October would not bode well for tree limbs and widespread power outages became a major concern.
Critical Temperature Profiles
As a low pressure system approached from the Carolinas, a second system began to spin off the Atlantic coast. Even though the synoptic conditions were aligning for the development of a Nor’easter, there was still much uncertainty about the characteristics of the air masses involved. Weather forecast models disagreed on the chilliness of the air mass moving towards the coast and made it extremely difficult for forecasters to predict where snow verses rain would fall. In addition, slight variations in storm track by as little as 20-30 miles would make a big difference in who received heavy rain, and who received heavy snow.
During the morning of the event, the 8am Dulles International Airport (IAD) temperature profile from weather balloon data hugged the freezing line. This profile suggested that the atmosphere east of the Blue Ridge Mountains was only slightly cold enough to support a snow event. The red arrow in the figure below points to the temperature (red) and dew point temperature (green) vertical profiles and the black dashed-line highlights the freezing line. A warmer air mass being ushered in the lower levels of the atmosphere is also shown in the black box.
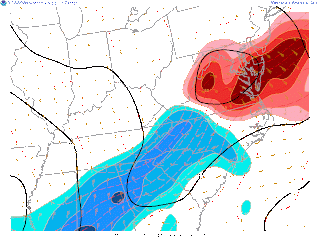
Baltimore was spared heavy snow because in October, the Atlantic water temperature is still quite warm, and kept temperatures just above freezing in the critical snow-making layer in the clouds at 5,000 ft. The image below shows the region of warming (called warm air advection, red colors) in the lower atmosphere, as southeasterly winds moved warm Atlantic air in over the Baltimore region:
Cold enough for snow? Forecast Models Help Solve The Dilemma
Due to widespread forecast disparity for snow accumulations east of the Blue Ridge, (NAM model forecasting > 10 inches, GFS model forecasting a < 1 inch), forecasters relied on the High Resolution Rapid Refresh (HRRR) model guidance. This experimental model has better temporal and spatial resolution than the aforementioned operational models. After forecasters analyzed the HRRR’s forecast for a swath of heavy snow accumulating over the next 15 hours along a southwest-northeast axis, confidence grew that this would be a significant snow event to the north of the Mason-Dixon Line.
By mid-afternoon, the coastal low pressure system began to strengthen as it tracked northeasterly, parallel to the Mid-Atlantic coast. Cold air wrapped around the backside of the counterclockwise spinning system and collided with relatively warm air over the Atlantic coast. The converging air masses induced a nebulous rain-snow transition line and therefore heavy bands of mixed precipitation along the I-95 corridor.
This weather radar snapshot captures the very narrow rain-snow line that set up just to the north and west of Baltimore:
Periods of moderate rain during the morning hours gave way to intense episodes of sleet during the afternoon, and finally moderately heavy snow that tapered to flurries by late afternoon. The transition occurred as the low moved to the northeast, wrapping in a cold air mass from the north on its back side.
Gusty Winds
The increasing pressure gradient between this system and an approaching high pressure system from the west kicked off gusty winds throughout the day as well. Because of exceptionally vigorous jet stream energy above the storm, the Nor’easter rapidly deepened, becoming what is called a “meteorological bomb”. The powerful winds reduced visibility conditions to less than 3 miles at BWI airport and held the “feels-like” or wind chill temperature below freezing for most of the day! (black box = temperature, blue box = wind chill temperature, red box = wind gusts and visibility).
Winds were much more significant to the northeast of Baltimore, where gusts in the 50-60 mph were commonplace along the New England coast:
First Freeze of the Season
After the winter storm headlines expired, strong northwest flow behind the system ushered in the chilliest air mass of the season and prompted NWS Sterling forecasters to issue a Freeze Warning for the Baltimore-Washington corridor Saturday night. The Dulles weather balloon data at 8pm indicated a much cooler temperature profile compared to the morning profile. In the figure below, the red arrow points to the temperature profile well below the black-dashed freezing line and the chilly northerly winds in the lower atmosphere are shown in the black box.
Accumulated Snowfall
According to unofficial observations submitted to the NWS office in Sterling, storm total snowfall varied from a measured trace in eastern Maryland to nearly 12 inches across west and northern portions of the state. The HRRR 15 hour snow accumulation forecast listed above verified quite well with the heaviest snow accumulation along a southwest-northeast axis. The heavy snowfall across the W. Va panhandle and western Maryland reflects mainly below freezing temperatures prevalent at the higher elevations. The heavy snow across New England reflects a combination of higher elevation temperatures, and below-freezing air transported toward the coast by the low.
Snow from Space
Finally we see a snapshot from the MODIS sensor onboard NASA’s Aqua satellite. This image was captured Sunday, the day after the event, and shows only the remnants of the rare October Nor’easter.


No comments:
Post a Comment